Reinforcement Learning for Traffic Signal Control
Open Datasets
We provide different traffic datasets, each includes both road network (roadnet.json) and traffic flow file (flow.json), whose formats are defined in Roadnet File Format and Flow File Format respectively.
*All methods are measured in Average Travel Time (in seconds) under CityFlow simulator.
| # |
Dataset name |
Number of
Intersections
|
Time Span
(Seconds) |
Description |
Referred result* |
Referred method |
| 1 |
hangzhou_1x1_bc-tyc_18041607_1h |
1 |
3600 |
These datasets are based on camera data in Hangzhou.
Due to the lack of records about turning vehicles, the turning ratios of each dataset are fixed, with 10% as turning left, 60% as going straight, and 30% as turning right. The turning-right vehicles are discarded since they are not under the control of traffic lights.
There are one left-turn lane and one straight lane in each direction in each roadnet. |
221.03 |
SOTL |
| 2 |
hangzhou_1x1_bc-tyc_18041608_1h |
1 |
3600 |
334.72 |
SOTL |
| 3 |
hangzhou_1x1_bc-tyc_18041610_1h |
1 |
3600 |
213.20 |
SOTL |
| 4 |
hangzhou_1x1_kn-hz_18041607_1h |
1 |
3600 |
72.48 |
SOTL |
| 5 |
hangzhou_1x1_kn-hz_18041608_1h |
1 |
3600 |
64.10 |
SOTL |
| 6 |
hangzhou_1x1_qc-yn_18041607_1h |
1 |
3600 |
117.24 |
SOTL |
| 7 |
hangzhou_1x1_qc-yn_18041608_1h |
1 |
3600 |
131.99 |
SOTL |
| 8 |
hangzhou_1x1_sb-sx_18041607_1h |
1 |
3600 |
173.85 |
SOTL |
| 9 |
hangzhou_1x1_sb-sx_18041608_1h |
1 |
3600 |
290.00 |
SOTL |
| 10 |
hangzhou_1x1_tms-xy_18041607_1h |
1 |
3600 |
214.77 |
SOTL |
| 11 |
hangzhou_1x1_tms-xy_18041608_1h |
1 |
3600 |
325.32 |
SOTL |
| 12 |
syn_1x1_uniform_200_1h |
1 |
3600 |
These datasets are generated artificially. The vehicles enter the road network uniformly with a fixed entering ratio chosen from 200, 400 and 600 vehicles per hour. |
61.44 |
SOTL |
| 13 |
syn_1x1_uniform_400_1h |
1 |
3600 |
133.40 |
SOTL |
| 14 |
syn_1x1_uniform_600_1h |
1 |
3600 |
189.11 |
SOTL |
| 15 |
jinan_3x4_hongqi_16XXXXXX_1h |
12 |
3600 |
The road network contains 12 intersections in a 3x4 grid. Each intersection has four incoming approaches and four outgping approaches, and each approach has three lanes (left-turn, through and right-turn respectively).
The traffic flow data is based on camera data in Jinan. Necessary simplification is done due to the low quality of the real-world data. |
|
|
| 16 |
hangzhou_4x4_gudang_18010207_1h |
16 |
3600 |
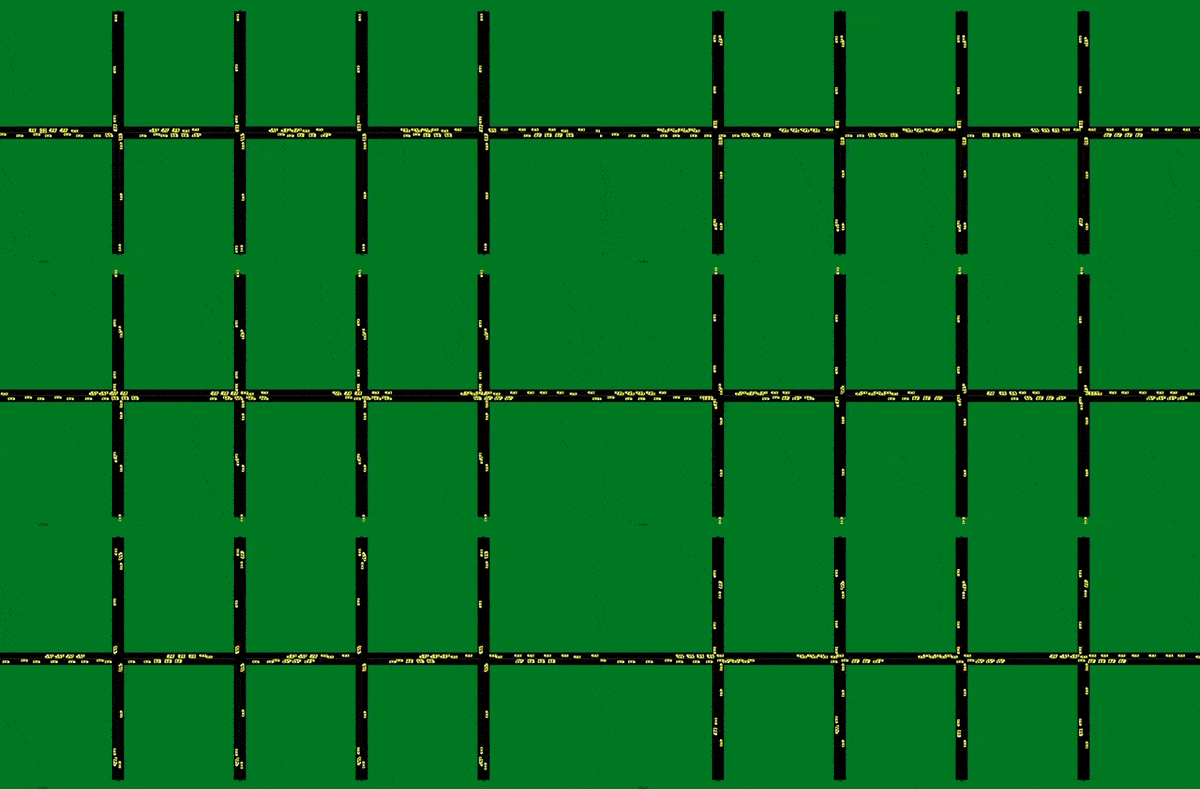
The road network contains 16 intersections in a 4x4 grid. Each intersection has four incoming approaches and four outgping approaches, and each approach has three lanes (left-turn, through and right-turn respectively).
The traffic flow data is based on camera data in Hangzhou. Necessary simplification is done due to the low quality of the real-world data.
• Traffic volume: the traffic volume is derived from camera data at Hangzhou.
• Turning ratio: 10% (turning left), 60%(going straight) and 30% (turning right). This is synthesized from the statistics of taxi GPS data. |
240.97 |
MaxPressure |
| 17 |
syn_1x3_gaussian_500_1h |
3 |
3600 |
The road network contains 16 intersections in a 4x4 grid. Each intersection has four incoming approaches and four outgping approaches, and each approach has three lanes (left-turn, through and right-turn respectively).
• Traffic volume: All the vehicles enter and leave the network from the rim edges.For each entering edge, the number of the vehicles generated is sampled from a Gaussian distribution with mean as 500 vehicles/hour/lane.
• Turning ratio: 10% (turning left), 60%(going straight) and 30% (turning right) |
422.95 |
MaxPressure |
| 18 |
syn_2x2_gaussian_500_1h |
4 |
3600 |
477.71 |
MaxPressure |
| 19 |
syn_3x3_gaussian_500_1h |
9 |
3600 |
631.75 |
MaxPressure |
| 20 |
syn_4x4_gaussian_500_1h |
16 |
3600 |
689.68 |
MaxPressure |
| 21 |
Manhattan_1 | 2510 |
3600 |
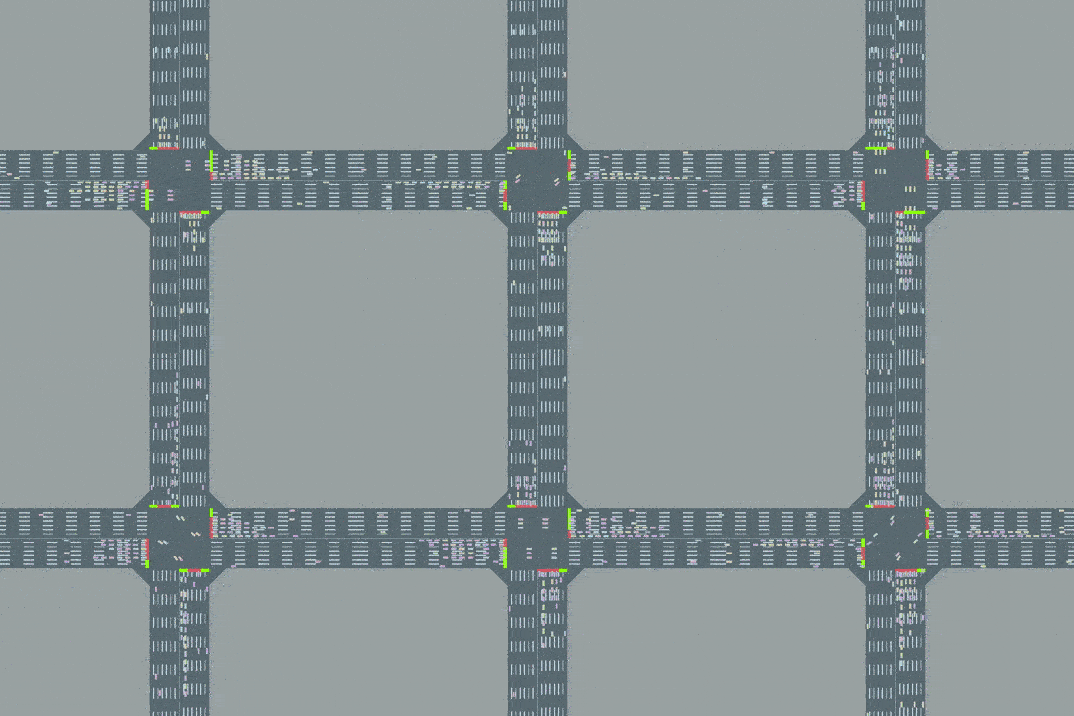
The road network contains 2510 intersections in Manhattan, New York. The road network is converted from SUMO default road net into the CityFlow format.
• Traffic volume: Vehicles enter and leave the network could appear in every node in the network.For each entering edge, the number of the vehicles generated is sampled from a taxi trajectory data.
• Turning ratio: 10% (turning left), 60%(going straight) and 30% (turning right) |
|
|
| 22 |
Manhattan_2 | 2510 |
3600 |
|
|
| 23 |
Manhattan_3 | 2510 |
3600 |
|
|
| 24 |
LA_1x4 |
4 |
3600 |
The road network contains 4 intersections in LA. |
|
|
| 25 |
Atlanta_1x5 |
5 |
3600 |
The road network contains 5 intersections in Atlanta. |
|
|
| 26 |
Manhattan_16x3 |
48 |
3600 |
The road network contains 48 intersections in Manhattan. |
|
|
| 27 |
Manhattan_28x7 |
196 |
3600 |
The road network contains 196 intersections in Manhattan. |
|
|
If you use the datasets in your paper, please cite the following papers:
@article{wei2019survey,
      title={A Survey on Traffic Signal Control Methods},
      author={Wei, Hua and Zheng, Guanjie and Gayah, Vikash and Li, Zhenhui},
      journal={arXiv preprint arXiv:1904.08117},
      year={2019}
    }
@inproceedings{wei2019colight,
      title={Colight: Learning network-level cooperation for traffic signal control},
      author={Wei, Hua and Xu, Nan and Zhang, Huichu and Zheng, Guanjie and Zang, Xinshi and Chen, Chacha and Zhang, Weinan and Zhu, Yanmin and Xu, Kai and Li, Zhenhui},
      booktitle={Proceedings of the 28th ACM International Conference on Information and Knowledge Management},
      pages={1913--1922},
      year={2019}
    }
@inproceedings{zheng2019frap,
      title={Learning phase competition for traffic signal control},
      author={Zheng, Guanjie and Xiong, Yuanhao and Zang, Xinshi and Feng, Jie and Wei, Hua and Zhang, Huichu and Li, Yong and Xu, Kai and Li, Zhenhui},
      booktitle={Proceedings of the 28th ACM International Conference on Information and Knowledge Management},
      pages={1963--1972},
      year={2019}
    }
